Solar Panel Thermal Inspection
Maximize solar farm output. Identify defective cells, string failures, and diode issues across utility-scale arrays with IEC-standard drone thermal imaging.
Overview
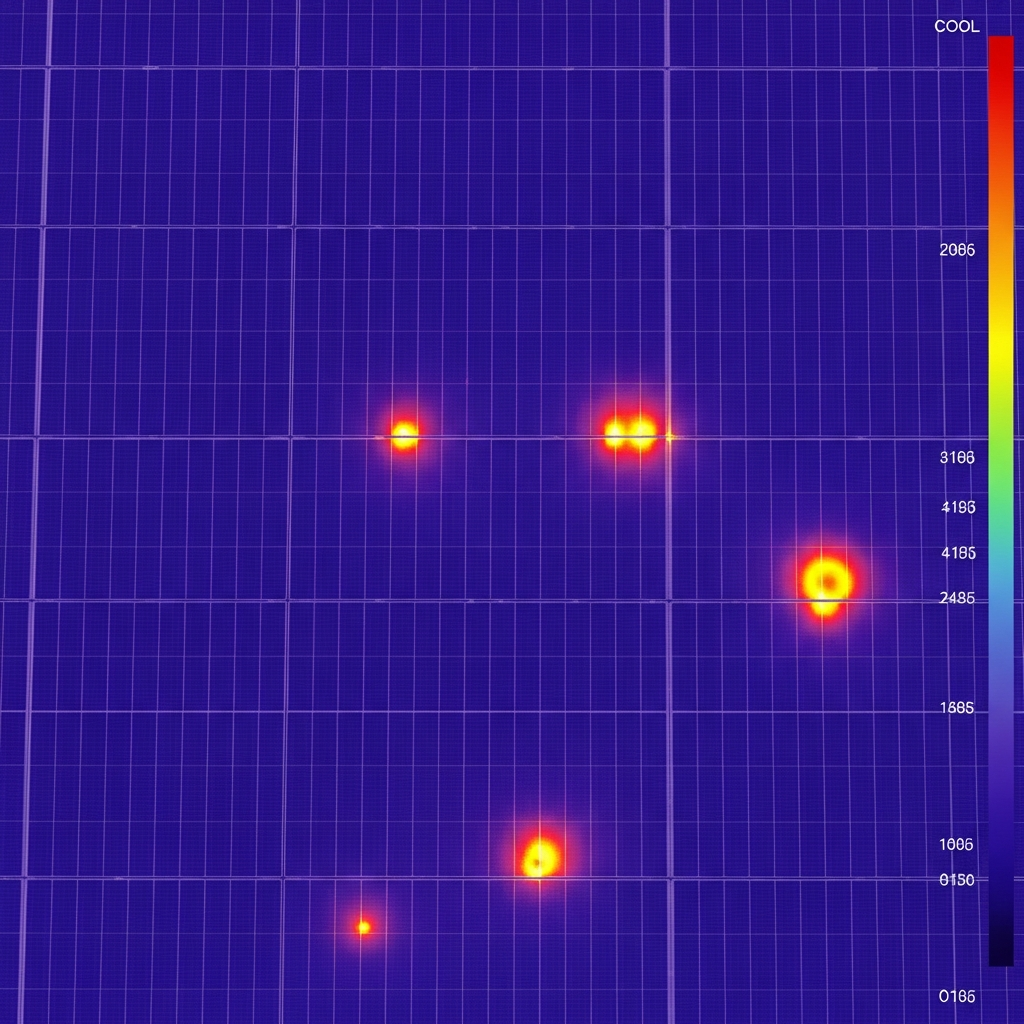
For utility-scale solar farms, manual I-V curve tracing is too slow to keep up with O&M demand. Holmes and Watson provides rapid aerial thermography following IEC TS 62446-3 standards, detecting cell-level defects, bypass diode failures, and full string outages across thousands of panels in a single mission. O&M teams get a prioritized, geolocated defect list that goes straight into the work-order system.
Why Choose Drone Solar Thermography
Aerial thermography is the only practical way to inspect a utility-scale solar farm comprehensively. A 50 MW site can be fully scanned in a single day; the same coverage by hand would take weeks. The defensible defect data that comes out of the mission goes straight to maintenance work orders, restoring lost power production faster.
When to use it: Use solar thermography annually for O&M, post-installation commissioning, after hail or severe weather events, prior to acquisition or warranty disputes, and when sudden production drops indicate undiagnosed array failures.
What We Inspect
- Individual cell hot spots and micro-cracks
- Activated bypass diodes and submodule failures
- Offline strings and combiner box anomalies
- PID (Potential Induced Degradation) patterns
- Vegetation shading and soiling issues
- Tracker and inverter heat anomalies
Our Process
Standardization
Flights conducted under IEC-compliant irradiance levels (>600 W/m²) with verified module orientation and clear-sky conditions.
Rapid Scanning
Multi-rotor flights with paired radiometric thermal and high-resolution RGB payloads cover full arrays efficiently.
AI-Assisted Analysis
Automated defect detection algorithms classify anomalies by severity and type, then verified by certified thermographers.
Integration
Exporting localized defect coordinates directly to your CMMS or asset management software.
Deliverables
Comprehensive digital twin of the solar asset, categorized anomaly list with GPS coordinates, severity classification, estimated power loss calculations, PDF summary, and CMMS-compatible export.
Cost Factors
- Site capacity (MW) and total module count
- Site geometry complexity (single-axis tracking, terrain)
- Annual program vs. one-off scan (annual programs are significantly cheaper per visit)
- Reporting depth and CMMS integration requirements
Frequently Asked Questions
Related Services
Request Solar Thermography
Get a detailed proposal and flight plan for your specific asset.
Get a Quote (540) 632-3458Trust Signals
- • FAA Part 107 Certified Pilots
- • NACHI Thermography Certified
- • Licensed NC Building Class Contractors
- • 20+ Active Industry Certifications
- • Fully Insured for Commercial Operations